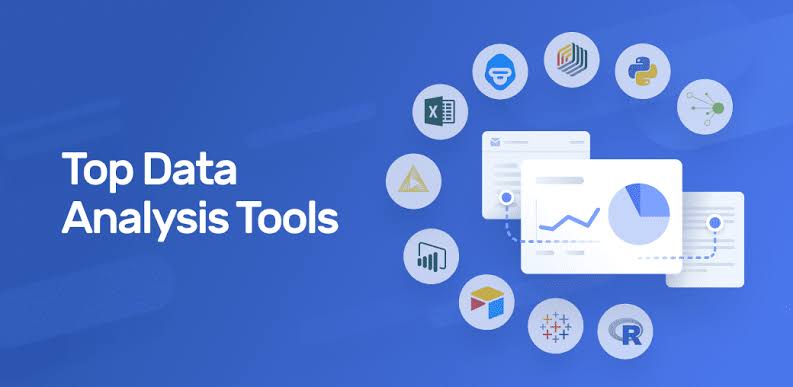
Data science has revolutionized how businesses and researchers interpret data. Providing deeper insights and fostering informed decision-making. The rapid evolution of data science tools has empowered analysts to process analyze and visualize vast datasets with ease. And accuracy. Here are top 10 data science tools for analysis, each offering unique features to streamline your workflow and enhance your data analysis capabilities.
1. Python
Python has become cornerstone in field of data science due to its simplicity. Its versatility and robust library support also contribute. Libraries such as NumPy Pandas and Matplotlib make Python an excellent tool for data manipulation. Additionally, statistical analysis and data visualization are strengths. Python's seamless integration with machine learning libraries. Libraries like Scikit-Learn and TensorFlow allow data scientists to build complex models efficiently. Its extensive community support ensures continuous improvements. Also a wealth of resources for learning and troubleshooting is available.
2. R
R is powerful programming language and environment specifically designed for statistical computing. And graphics. Its comprehensive package ecosystem including ggplot2 dplyr and caret, provides tools for data manipulation analysis and visualization. R excels in data mining and statistical analysis. It is favorite among researchers and data scientists in academia and industry. Its rich visualization capabilities enable the creation of detailed and aesthetically pleasing charts and graphs. Facilitating the interpretation of complex data.
3. Jupyter Notebooks
Jupyter Notebooks offer an interactive computing environment that allows data scientists to combine code execution, text, and visualizations in a single document. This open-source web application supports multiple programming languages, including Python, R, and Julia. Jupyter Notebooks enhance reproducibility and collaboration by enabling the sharing of interactive notebooks that document the entire data analysis process. Their flexibility and ease of use make them an invaluable tool for exploratory data analysis, prototyping, and teaching.
4. Tableau
Tableau is a leading data visualization tool that helps users transform raw data into interactive and shareable dashboards. Its drag-and-drop interface allows users to create complex visualizations without needing extensive coding skills. Tableau supports a wide range of data sources, including spreadsheets, databases, and cloud services, enabling seamless data integration. Its powerful analytics capabilities and user-friendly design make it a popular choice for businesses looking to leverage data for strategic decision-making.
5. Apache Spark
Apache Spark is an open-source distributed computing system designed for big data processing and analytics. It provides an efficient and scalable framework for handling large datasets, making it ideal for tasks like data transformation, machine learning, and stream processing. Spark's in-memory computing capabilities significantly speed up data processing, while its support for multiple programming languages, including Python, R, and Scala, offers flexibility to data scientists. Its integration with Hadoop and other big data tools makes Spark a cornerstone for modern data engineering and analytics workflows.
6. KNIME
KNIME (Konstanz Information Miner) is an open-source data analytics, reporting, and integration platform. It provides a user-friendly, visual interface for creating data workflows, enabling users to drag and drop nodes to perform various data processing tasks. KNIME's extensive library of nodes supports data cleaning, transformation, analysis, and machine learning. Its modular design allows easy integration with other tools and languages, such as Python and R, enhancing its flexibility and functionality. KNIME's ability to handle complex data workflows without coding makes it accessible to both novice and experienced data scientists.
7. RapidMiner
RapidMiner is a comprehensive data science platform that offers tools for data preparation, machine learning, and predictive analytics. Its intuitive drag-and-drop interface simplifies the creation of complex analytical workflows, making data science accessible to users with varying levels of expertise. RapidMiner supports a wide range of data sources and integrates seamlessly with popular big data platforms, such as Hadoop and Spark. Its advanced analytics capabilities and robust performance make it a valuable tool for businesses looking to harness the power of data for competitive advantage.
8. SAS
SAS (Statistical Analysis System) is a software suite developed for advanced analytics, business intelligence, data management, and predictive analytics. Known for its reliability and scalability, SAS is widely used in industries such as healthcare, finance, and government. Its extensive suite of tools supports data manipulation, statistical analysis, and machine learning, offering a comprehensive solution for data science projects. SAS's strong customer support and continuous innovation ensure it remains a top choice for organizations seeking robust analytical capabilities.
9. MATLAB
MATLAB is a high-level programming language and environment designed for numerical computing and data visualization. It is particularly popular in engineering and scientific research due to its powerful mathematical functions and toolboxes for specific applications, such as signal processing and image analysis. MATLAB's intuitive syntax and extensive documentation make it accessible to users with varying levels of programming experience. Its visualization capabilities enable the creation of high-quality plots and interactive graphics, facilitating the exploration and interpretation of data.
10. Excel
Excel remains a ubiquitous tool in data analysis due to its widespread availability and ease of use. While not as powerful as specialized data science tools, Excel offers robust features for data manipulation, statistical analysis, and visualization. Its functions, pivot tables, and charting capabilities enable users to perform a wide range of analytical tasks. Excel's integration with other Microsoft Office tools and its ability to handle moderate-sized datasets make it a valuable tool for quick analysis and reporting.
Conclusion
The field of data science is continually evolving, with new tools and technologies emerging to meet the growing demands for data analysis and interpretation. The top 10 data science tools highlighted in this article offer a range of capabilities, from programming and statistical analysis to visualization and big data processing. By leveraging these tools, data scientists can enhance their analytical workflows, uncover deeper insights, and drive more informed decision-making. Whether you're a seasoned data scientist or just starting, incorporating these tools into your toolkit can significantly boost your productivity and effectiveness in tackling complex data challenges.
